Design models look closer when you remove the harness.
I wanted to know how much of “good AI design” lives inside the base model, and how much lives in the product wrapped around it. So I ran fourteen model configurations through the same boring harness and asked them to make the same product pages.
The question I actually cared about
The internet argument is usually phrased as “which model has taste?” I do not think that is the right unit of analysis anymore. When you use a coding product, you are not only using a model. You are using a model inside a product harness.
Claude Code is a good example. Anthropic describes it as an agentic coding tool that can read a codebase, edit files, run commands, and integrate with development tools. Its docs also describe project memory, CLAUDE.md instructions, skills, subagents, hooks, permissions, and visual verification workflows. That is not “just Claude.” It is Claude plus a lot of carefully designed context and behavior.
That distinction matters for design work. A frontend-focused skill can explicitly say things like: avoid the generic AI tells, do not default to the purple gradient SaaS hero, pick a real typographic direction, create one visual idea, compare screenshots, iterate. If one product includes that taste layer and another call is a plain API completion, the comparison is not model versus model. It is system versus system.
The deliberately plain setup
I built a thin harness for this benchmark because I wanted to remove as much product scaffolding as I reasonably could. Each run is one request and one response. No file editing loop. No browser feedback. No Figma. No design system. No model-specific frontend skill. No “make it more premium” second pass.
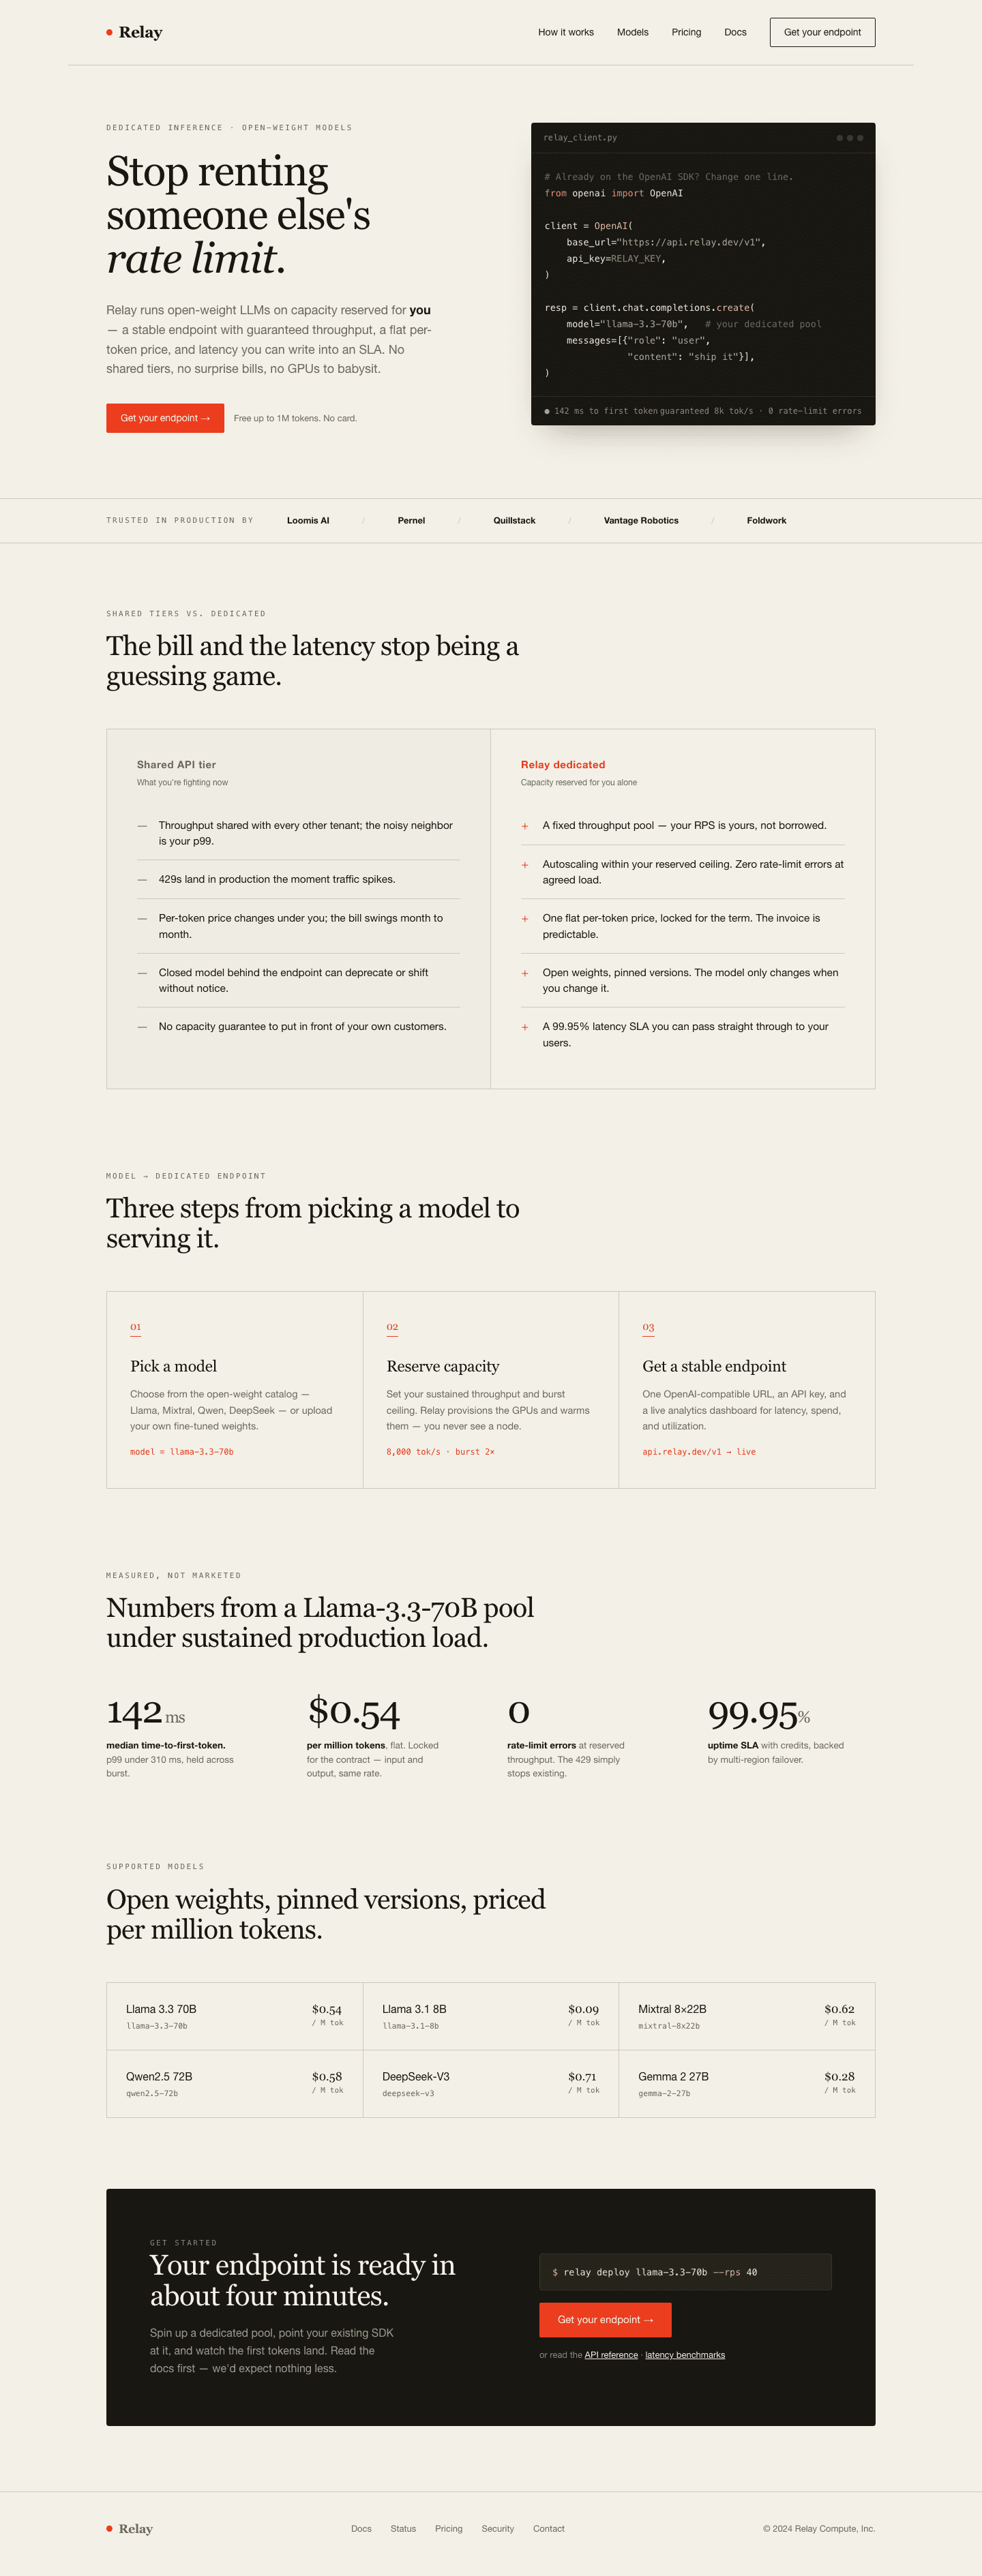
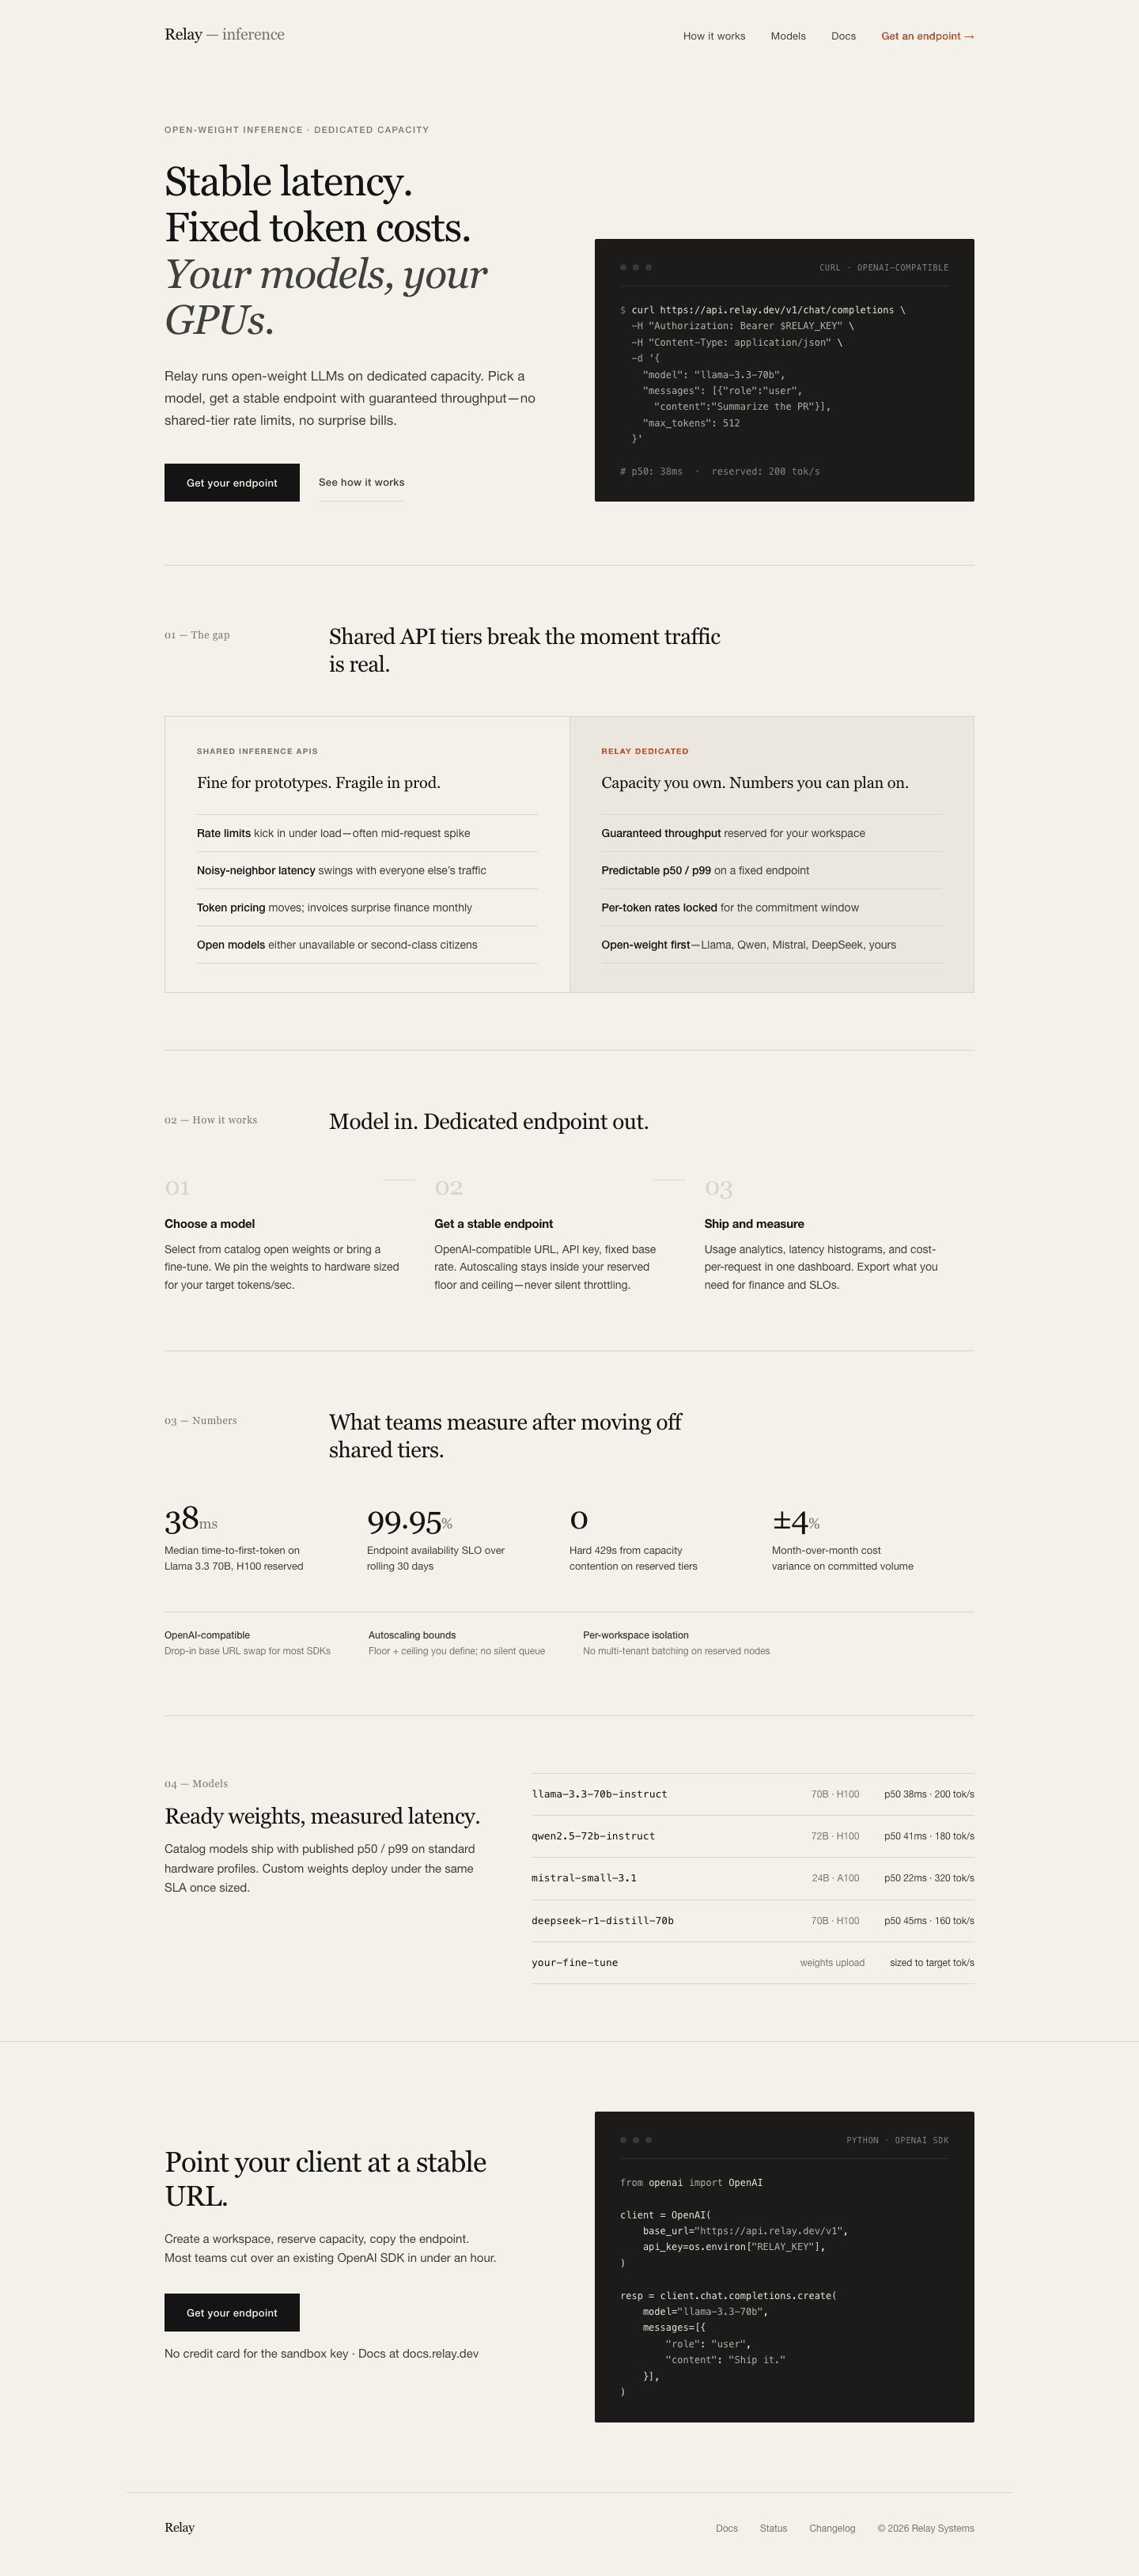
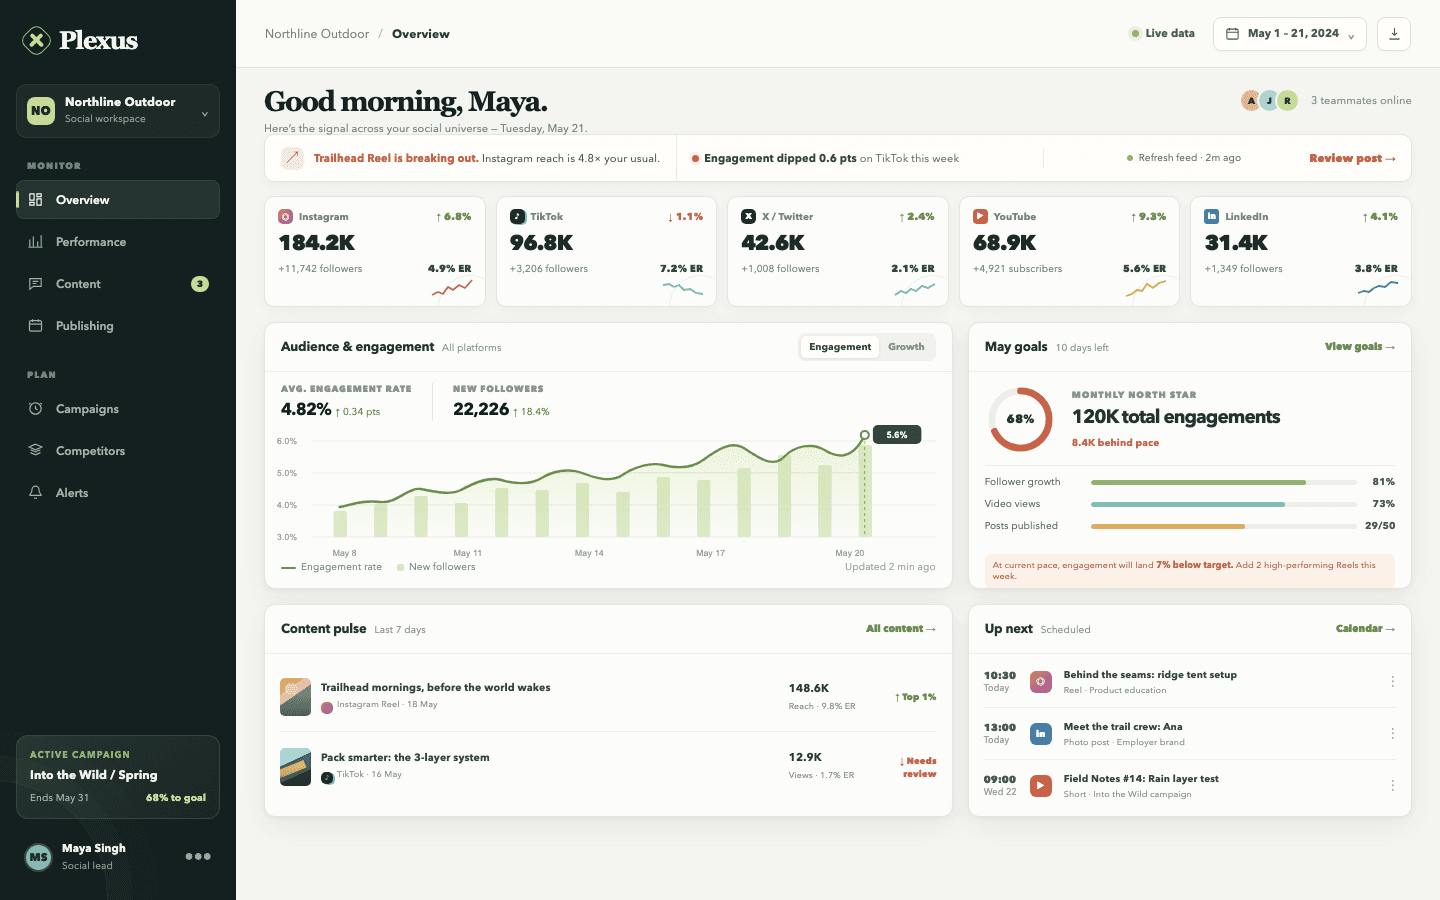
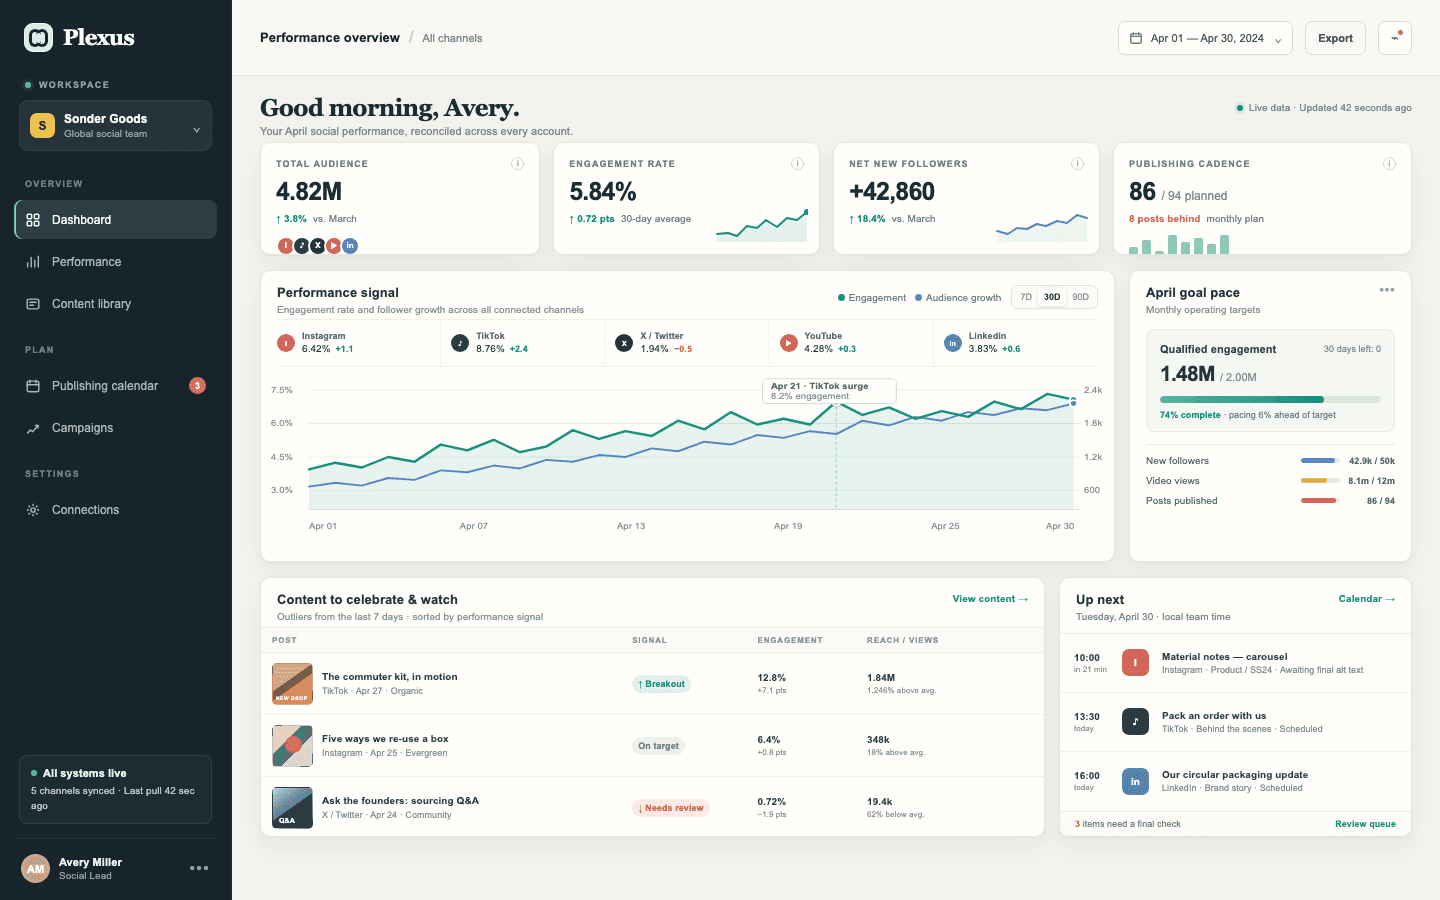
- Two fictional products: Relay, an inference-platform landing page, and Plexus, a dense social analytics dashboard.
- Three fixed directions: minimal/editorial, bold/expressive, and refined/premium.
- Three runs per product and direction, so a single lucky output does not define a model.
- One output contract: complete standalone HTML, inline CSS, no external requests.
I did include a short, neutral anti-generic paragraph in the shared system prompt. That was intentional. I did not want to test how often a model defaults to the most obvious template; I wanted to test execution after all models were given the same basic warning.
The first run covered eight models in June. I expanded it in July with Claude Fable 5, GPT-5.6 Luna, Terra, Sol, and Terra Pro. The prompt and brief hashes stayed unchanged. Terra and Sol used the same bare Codex subscription route as GPT-5.5; Luna and Terra Pro used OpenRouter pinned to OpenAI. Luna was available in the Codex client, but its bare subscription endpoint rejected the model. I did not route it through the Codex CLI because that would have added the very agent harness this experiment is trying to remove.
Grok 4.5 joined last through an authenticated Grok subscription while connected from the US. Its CLI can replace the agent system prompt and send a user message verbatim, so I used the same shared prompt, disabled tools, memory, planning, subagents, and web search, and kept reasoning effort high. The CLI does not report token usage or marginal subscription cost, so those fields are left blank rather than estimated.
Each published output now carries its own run record. The viewer shows the model ID, route, provider, timestamp, reported token counts, latency, retry count, validation result, prompt hashes, and the exact system and user prompts. The raw response, parsed HTML, and screenshots are also retained locally by the harness.
What came out
The strongest impression was not a neat ranking. It was how quickly the outputs converged into the same broad territory. Most models can now produce a competent landing page: a hero, a code block, a credibility row, a workflow section, a few invented metrics. Most can also fake a dashboard: KPI cards, platform rows, simple charts, scheduled posts, goals, alerts.
There are real differences. Some pages have better density. Some have more believable copy. Some dashboard layouts are easier to scan. Some models spend a lot of tokens thinking and still end up in familiar UI patterns. But the distance between them is much smaller than the distance between a raw one-shot prompt and a polished agent workflow with screenshots, memory, skills, retries, and taste rules.
Terra gives the cleanest base-versus-Pro comparison in the new group. Base Terra averaged about 8,900 output tokens per page. Terra Pro averaged about 27,200 from the same prompts, a little over three times as much. The extra inference produced more code and detail, but it did not move the work into a completely different design language. That is why I list Pro as a model configuration rather than pretending it is a separate base model.
That is the point I would carry forward: “model quality” is not a single number. For product work, the interaction loop and taste layer matter as much as the base model, sometimes more.
What the run logs add
The final dataset contains 252 valid pages. For the 234 API-backed cells that reported usage, the total was about 4.26 million output tokens. The median reporting page used 14,604 output tokens; the middle half ran from roughly 11,200 to 23,700. Of the 252 cells, 241 completed on the first attempt. Eleven cells needed at least one retry, for 17 extra attempts in total. The published set finished with zero external render requests and zero output-contract lint violations.
The brief affected implementation size in predictable ways. Plexus dashboards averaged about 19,900 output tokens, compared with 16,600 for Relay landing pages. The refined direction averaged 20,700 tokens, about 31 percent more than the minimal direction at 15,800. Asking for more density and detail measurably changed how much implementation the models produced, even when the broad page structures remained familiar.
Model verbosity varied much more than the recurring design grammar. MiniMax M3 and Nex-N2-Pro averaged roughly 34,600 and 33,800 output tokens per page. Terra and Mistral Large 3 averaged about 8,900 and 8,700. More tokens sometimes bought denser detail, but they did not automatically buy a more original composition. This is also not a perfectly clean measure of effort because providers account for hidden reasoning tokens differently.
OpenRouter reported $32.25 for the 162 routed cells in the final matrix. Fable 5 accounted for $14.01, Terra Pro for $8.68, and Opus 4.8 for $5.84. The Codex, Z.ai, and Grok routes were covered by subscriptions, so their records show no marginal API cost. Smoke tests and the subscriptions themselves are not included in that total.
This lines up with coding-agent research
This was a small design benchmark, not an academic study. But the result rhymes with recent agent benchmarks. Harness-Bench argues that agent capability should be reported at the model-harness configuration level, not attributed only to the base model. SWE-Bench Mobile reports up to a sixfold performance gap for the same model across coding agents. In Claw-SWE-Bench, the same GLM 5.1 backbone scored 19.1 percent with a minimal direct-diff adapter and 73.4 percent with the full adapter.
None of those papers are about making pretty dashboards. They are about software agents. But the underlying lesson transfers: once a model is placed inside a tool-using system, the wrapper becomes part of the product's intelligence.
What I would not claim
I would not claim that all models are equal. They are not. I would also not claim that the benchmark proves Claude Code's exact private prompt is responsible for its frontend taste. I do not have that prompt, and Anthropic's public system-prompt page is about Claude web and mobile prompts, not a full disclosure of every product-specific coding harness.
The safer claim is still useful: Claude Code is publicly documented as a rich agentic environment, and rich environments can encode preferences that a bare API call does not have. If a tool tells the model what AI-looking design smells like, gives it a way to inspect screenshots, remembers your preferences, and lets you package a frontend skill, you should expect different outputs.
I would not treat this as a visual-quality leaderboard either. There are no blinded human preference scores yet, and token count is not a proxy for taste. Latency is also mixed across OpenRouter, Codex, Z.ai, and the Grok CLI route, so it says as much about serving paths and concurrency as it does about the models.
The prompt explicitly targeted a 1440 by 900 desktop viewport. Mobile screenshots are useful for spotting fixed-width layouts and overflow, but responsive design was not part of the scored contract. A real mobile evaluation would need its own prompt and acceptance criteria.
Finally, these are dated runs, not permanent facts about each model. Some model IDs are aliases rather than immutable snapshots, provider accounting for reasoning tokens differs, and the July additions ran after the June group. The per-output timestamp, route, model ID, and prompt hashes are there so those boundaries stay inspectable.
What I would test next
The cleaner experiment would be a ladder: bare prompt, shared anti-generic prompt, shared design skill, then agent loop with screenshot feedback. Same models, same products, same evaluator. That would show how much each layer adds.
I also want pairwise human preference data. Looking at the outputs manually is useful, but subjective. The showcase is set up so the next step can be blind comparisons rather than a fake objective leaderboard.
Sources and further reading
- Claude Code overview: Anthropic's description of Claude Code as an agentic coding tool with files, commands, git, MCP, memory, skills, and hooks.
- Claude Code best practices: verification loops, screenshots, CLAUDE.md, hooks, skills, subagents, and prompt specificity.
- Anthropic system-prompt release notes: public documentation that Claude web and mobile use updated system prompts, separate from the API.
- Harness-Bench, SWE-Bench Mobile, and Claw-SWE-Bench: recent work treating agent harnesses as first-class benchmark variables.